By Fred Cronenwett
I would like to apologize about incorrectly stating that Steve Kretschmer flew the Miss Los Angles racer. That was flown by James Satawa.
We were all happy to see the rain clear away Saturday so we could get two rounds flown. Although it was breezy, the models handled it well. After rounds 2 and 3 were completed, only a few people flew in round 4.
Steve Kretschmer worked late into the night Friday to repair the damage to his highly detailed P-39 that he is flying in Sport Scale. Steve pulled off the second-highest scoring flight on round 2. He flew again on round 3 but suffered additional damage on that landing. Steve earned the High Static award in this category, which made it possible to get first place in sport scale. Despite having damage to the airplane, he was able to get enough static and flying points to win. Peter Bauer took second place
1/2A Scale was as competitive as ever. Dave Betz is Christopher DeGroff’s grandfather. Christopher beat his grandfather to earn second place, and Dave earned third place. Mike McHenry had a clear lead to earn first place. It’s worth noting that the highest-scoring flight in 1/2A Scale was flown by Christopher!
Fun Scale comes down to the flying score. Mike McHenry put two high-scoring flights in to be the clear winner in that event.
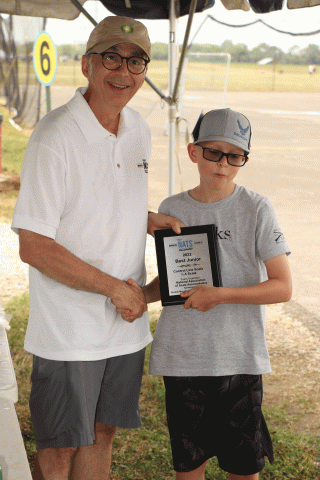
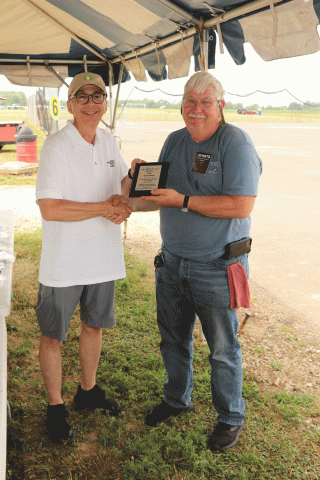
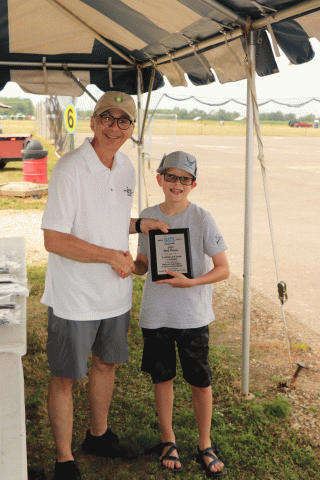
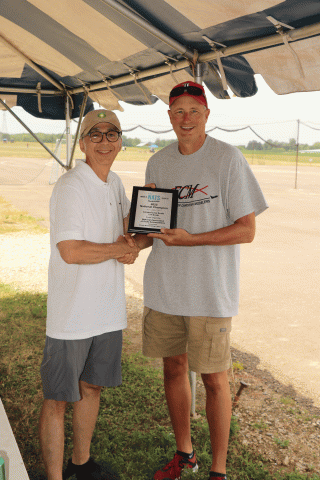
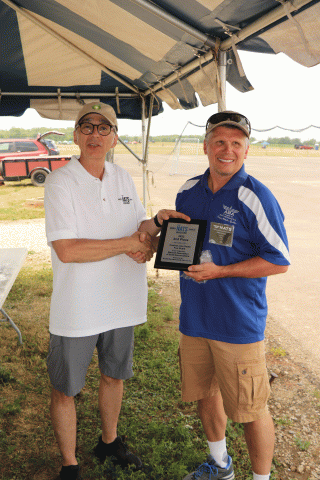
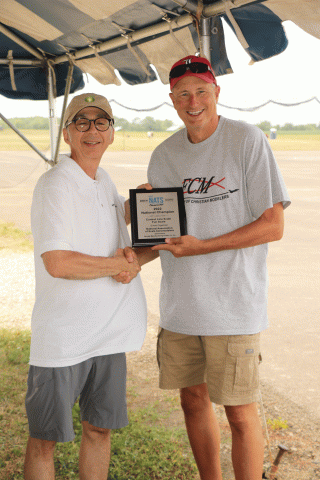
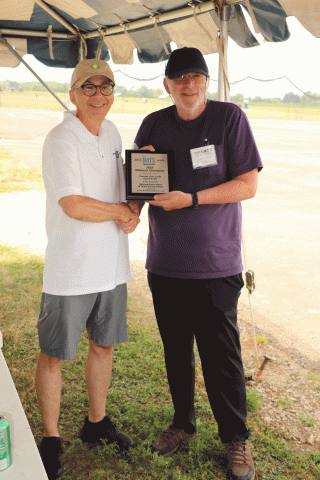
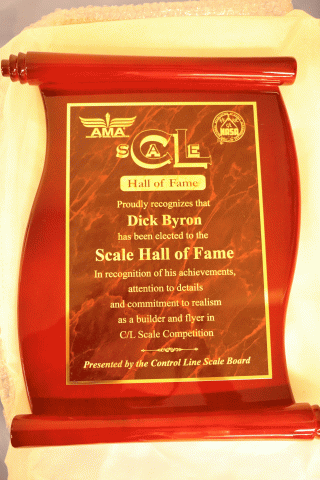
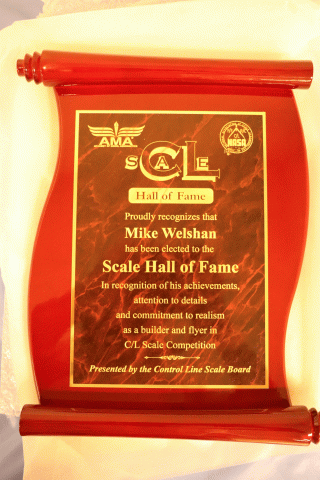
At the NASA (National Association of Scale Aeromodelers), banquet the High Static awards were handed out. Mike Welshans, Joe Cole, and Dick Byron were inducted into the CL Hall of Fame.
|
509 Sport Scale - Final Results |
||||||||||||||||||||||||||||||||||||||||||||||||
|
Pilots Name |
Static Score |
Flight #1 |
Flight #2 |
Flight #3 |
Flight #4 |
FINAL SCORE |
FINAL PLACE |
|
||||||||||||||||||||||||||||||||||||||||
|
Pete Bauer |
77.000 |
83.000 |
94.500 |
89.000 |
0.000 |
168.750 |
2 |
|
||||||||||||||||||||||||||||||||||||||||
|
Fred Cronenwett |
88.000 |
62.000 |
0.000 |
0.000 |
0.000 |
119.000 |
4 |
|
||||||||||||||||||||||||||||||||||||||||
|
Jeff Jensen |
75.000 |
61.500 |
87.000 |
82.850 |
84.250 |
160.625 |
3 |
|
||||||||||||||||||||||||||||||||||||||||
|
Steve Kretschmer |
90.000 |
61.750 |
91.750 |
76.000 |
0.000 |
173.875 |
1 |
|
||||||||||||||||||||||||||||||||||||||||
|
|
||||||||||||||||||||||||||||||||||||||||||||||||
|
521 Profile Scale - Final Results |
||||||||||||||||||||||||||||||||||||||||||||||||
|
Pilots Name |
Static Score |
Flight #1 |
Flight #2 |
Flight #3 |
Flight #4 |
FINAL SCORE |
FINAL PLACE |
|
||||||||||||||||||||||||||||||||||||||||
|
Fred Cronenwett |
93.500 |
87.250 |
90.250 |
82.000 |
0.000 |
182.250 |
1 |
|
||||||||||||||||||||||||||||||||||||||||
|
Jeff Jensen |
72.500 |
24.250 |
78.000 |
0.000 |
0.000 |
123.625 |
2 |
|
||||||||||||||||||||||||||||||||||||||||
|
|
||||||||||||||||||||||||||||||||||||||||||||||||
|
526 Fun Scale - Final Results |
||||||||||||||||||||||||||||||||||||||||||||||||
|
Pilots Name |
Static Score |
Flight #1 |
Flight #2 |
Flight #3 |
Flight #4 |
FINAL SCORE |
FINAL PLACE |
|
||||||||||||||||||||||||||||||||||||||||
|
Mike McHenry |
10.000 |
91.750 |
84.250 |
98.000 |
0.000 |
104.875 |
1 |
|
||||||||||||||||||||||||||||||||||||||||
|
Fred Cronenwett |
10.000 |
85.500 |
0.000 |
0.000 |
0.000 |
52.750 |
3 |
|
||||||||||||||||||||||||||||||||||||||||
|
Jeff Jensen |
10.000 |
0.000 |
0.000 |
0.000 |
0.000 |
10.000 |
4 |
|
||||||||||||||||||||||||||||||||||||||||
|
James Satawa |
10.000 |
90.250 |
79.500 |
82.750 |
0.000 |
96.500 |
2 |
|
||||||||||||||||||||||||||||||||||||||||
|
|
||||||||||||||||||||||||||||||||||||||||||||||||
|
527 Team Scale - Final Results |
||||||||||||||||||||||||||||||||||||||||||||||||
|
Pilots Name |
Static Score |
Flight #1 |
Flight #2 |
Flight #3 |
Flight #4 |
FINAL SCORE |
FINAL PLACE |
|
||||||||||||||||||||||||||||||||||||||||
|
Goff/McHenry |
94.000 |
97.000 |
0.000 |
0.000 |
0.000 |
142.500 |
1 |
|
||||||||||||||||||||||||||||||||||||||||
|
|
||||||||||||||||||||||||||||||||||||||||||||||||
|
529 1/2A Scale - Final Results |
||||||||||||||||||||||||||||||||||||||||||||||||
|
Pilots Name |
Static Score |
Flight #1 |
Flight #2 |
Flight #3 |
Flight #4 |
FINAL SCORE (if Fly 4 Rounds) |
FINAL PLACE (if Fly 4 Rounds) |
|
||||||||||||||||||||||||||||||||||||||||
|
Mike McHenry |
75.500 |
36.750 |
31.000 |
34.500 |
0.000 |
146.750 |
1 |
|
||||||||||||||||||||||||||||||||||||||||
|
Allen Goff |
76.000 |
28.000 |
0.000 |
0.000 |
0.000 |
104.000 |
5 |
|
||||||||||||||||||||||||||||||||||||||||
|
Richard Schneider |
77.750 |
36.500 |
0.000 |
0.000 |
0.000 |
114.250 |
4 |
|
||||||||||||||||||||||||||||||||||||||||
|
David Betz |
66.250 |
28.000 |
31.500 |
33.750 |
0.000 |
131.500 |
3 |
|
||||||||||||||||||||||||||||||||||||||||
|
Chris DeGroff |
66.250 |
0.000 |
37.000 |
32.500 |
0.000 |
135.750 |
2 |
|
||||||||||||||||||||||||||||||||||||||||
|
|
||||||||||||||||||||||||||||||||||||||||||||||||
|
F4B Scale - Final Results |
||||||||||||||||||||||||||||||||||||||||||||||||
|
Pilots Name |
Normalized Static Score |
Normalized Flight #1 |
Normalized Flight #2 |
Normalized Flight #3 |
FINAL SCORE |
FINAL PLACE |
|
|||||||||||||||||||||||||||||||||||||||||
|
Pete Bauer |
960.729 |
689.831 |
1000.000 |
0.000 |
1805.645 |
2 |
|
|||||||||||||||||||||||||||||||||||||||||
|
Allen Goff |
1000.000 |
1000.000 |
781.199 |
0.000 |
1890.599 |
1 |
|
|||||||||||||||||||||||||||||||||||||||||
Our NatsNews reporters are solely responsible for providing content for the daily reports.
